
Central Valley Aquifer of California supports 5 million residents and a $17 billion per year agricultural industry. More than 250 crops are grown in Central Valley, supplying up to half of the nation’s produce. It is truly the breadbasket of the country.
However, with high groundwater pumping, the valley is sinking.
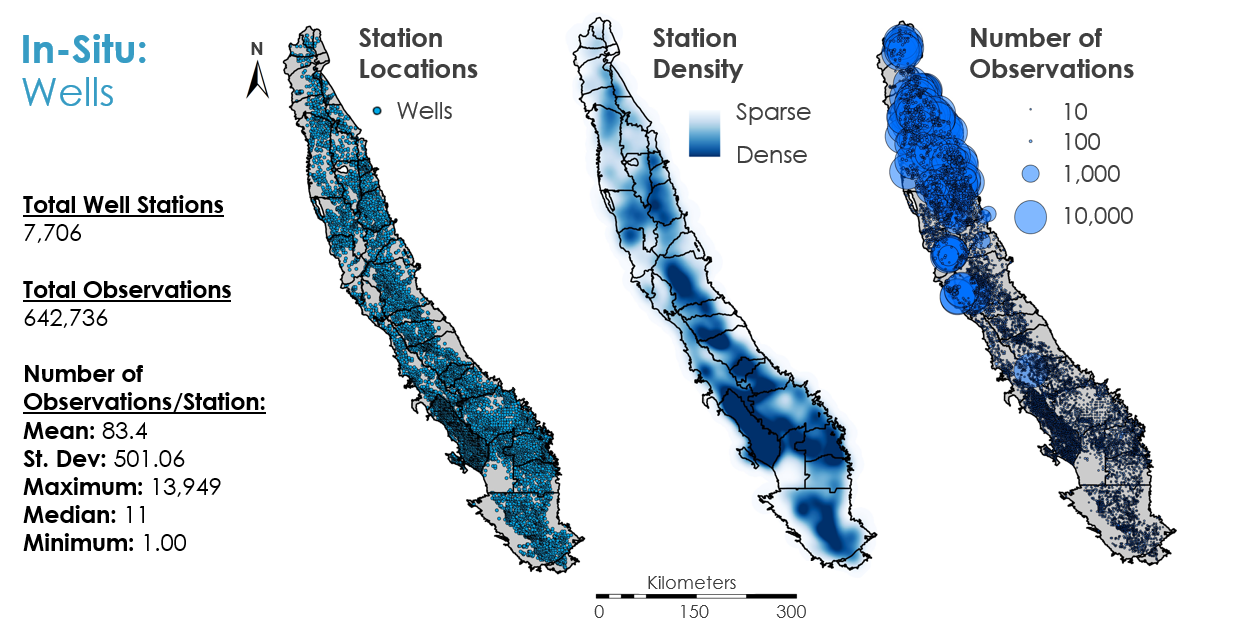
Well data can be sparse in space and time. We can use gravity-based missions like GRACE to track groundwater storage changes in the Central Valley.

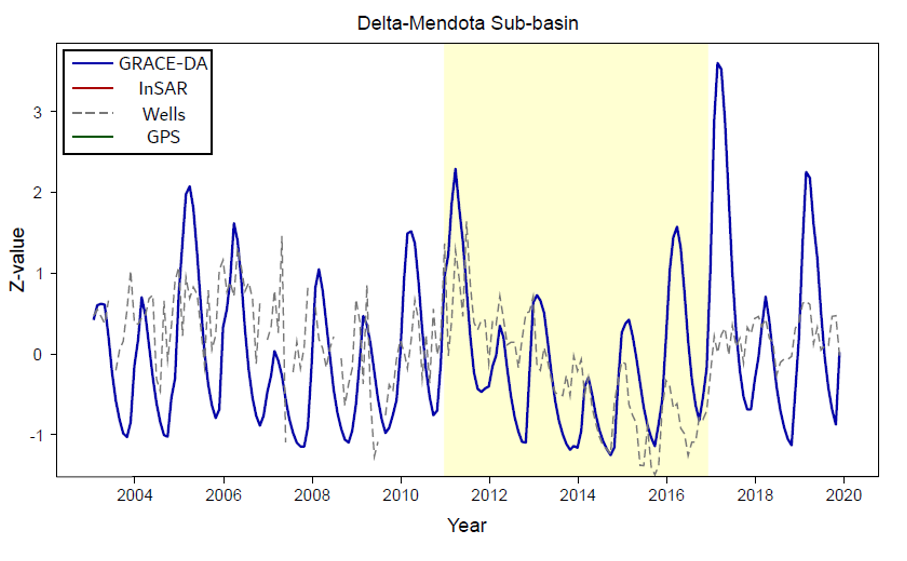
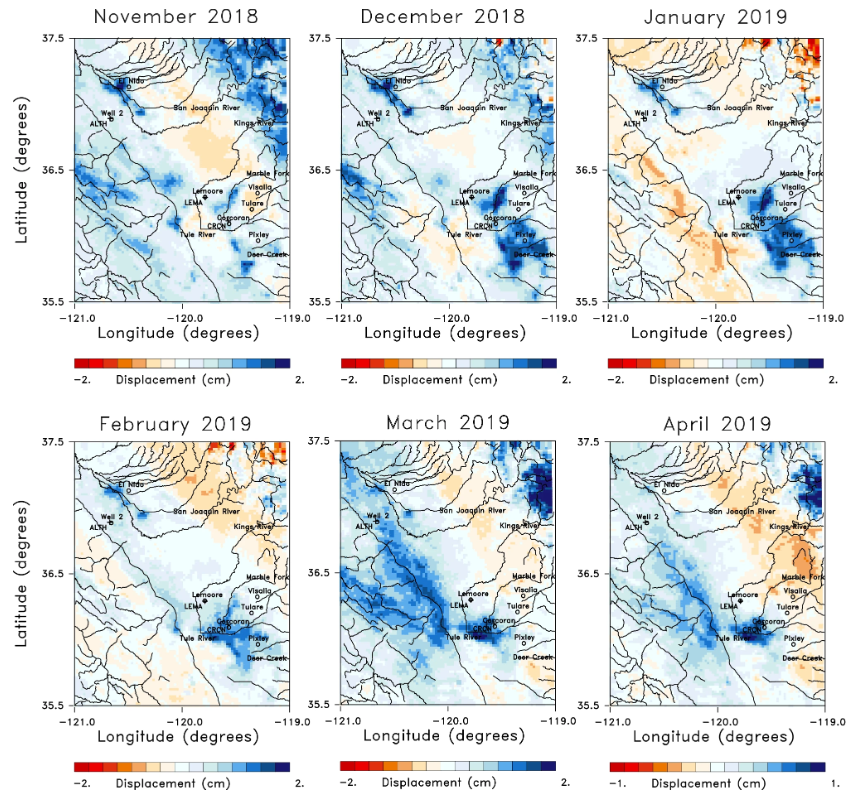
To track subsidence, radar methods such as InSAR can be used to understand land movement over time (figure below).
In my work with a team of NASA DEVELOP interns, we showed that remote sensing approaches can sufficiently complement or act in lieu of in-situ data.

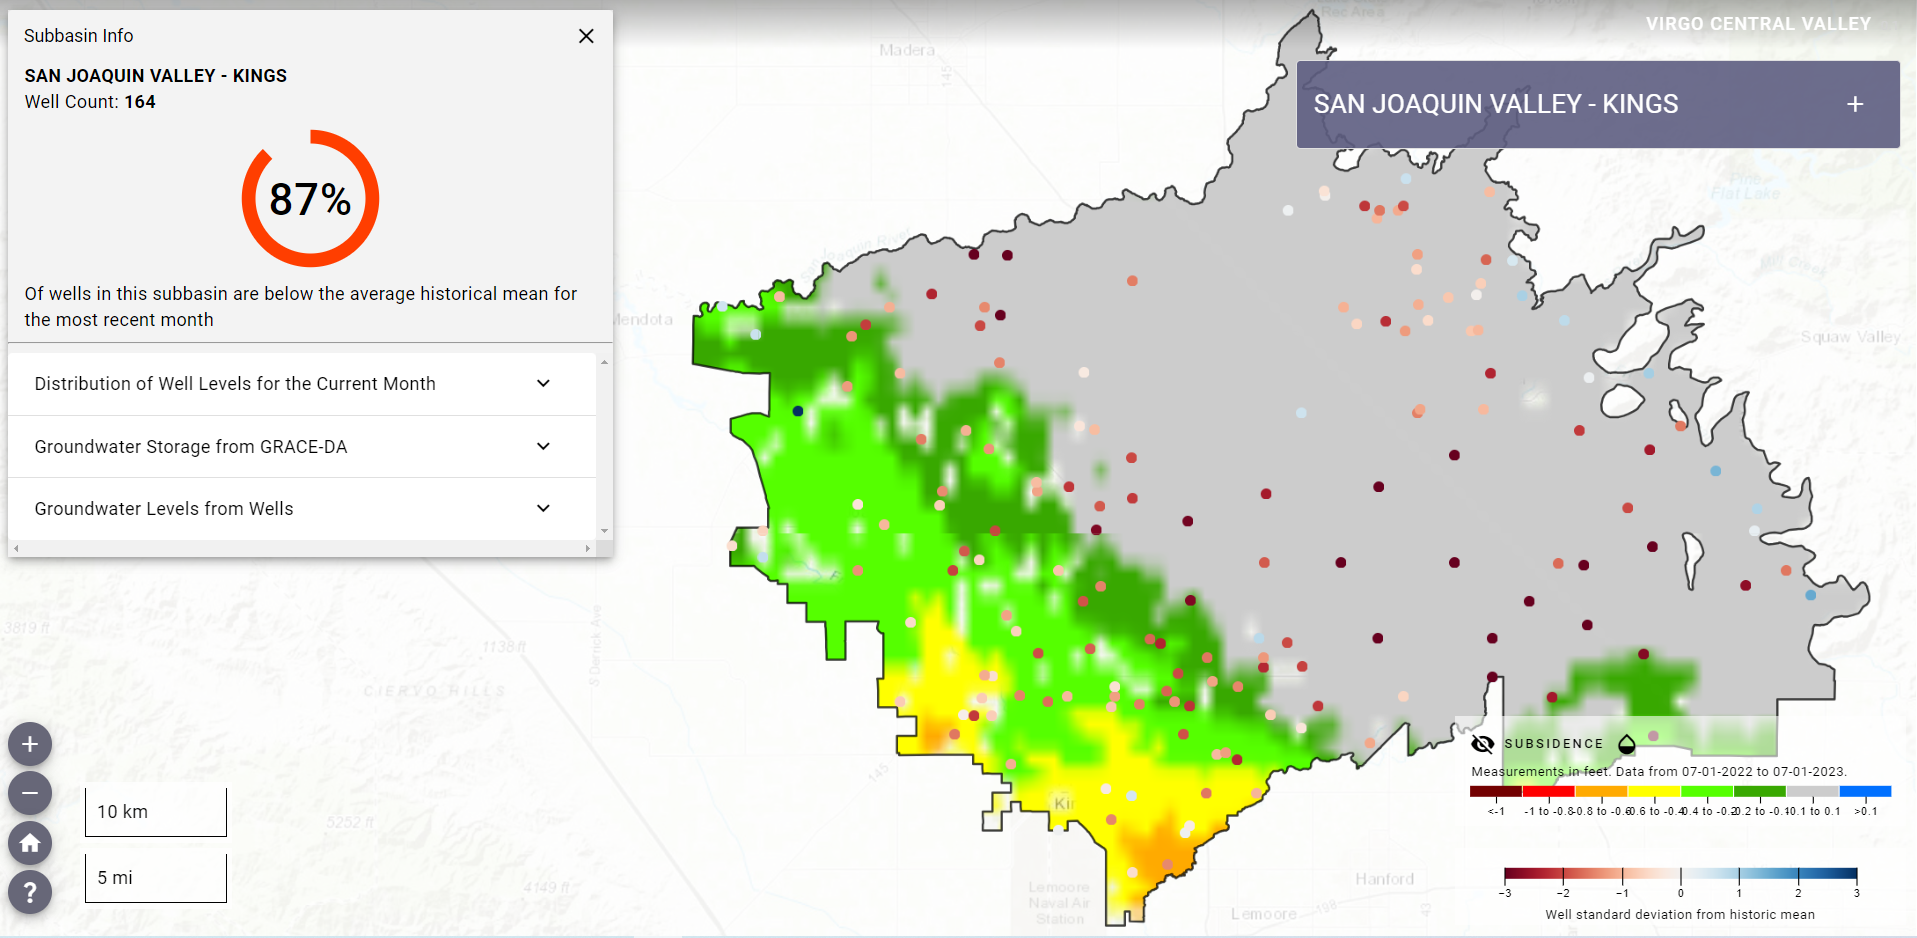
At JPL, I helped develop VIRGO: a tool to help water managers quickly visualize groundwater storage and subsidence for their basin of interest.
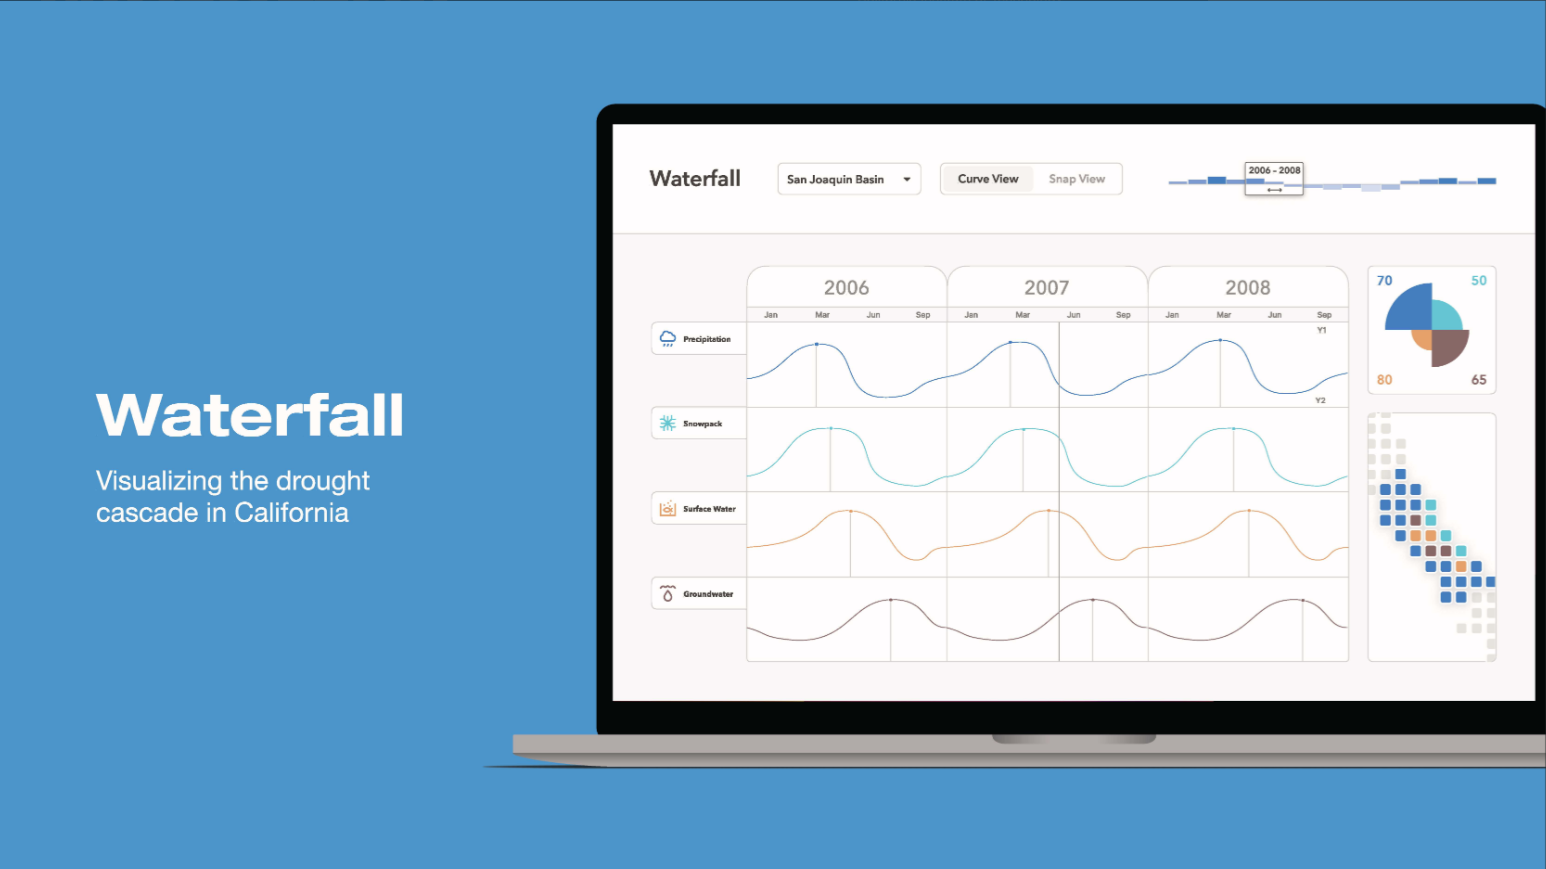
With the Data2Discovery Program, I also advised the development of Waterfall: a more design-friendly option for the public.
Waterfall won the Grand Prize at the AGU Michael H. Freilich Student Visualization Competition.
See my papers related to this effort
An Evaluation of Remotely Sensed and In Situ Data Sufficiency for SGMA-Scale Groundwater Studies in the Central Valley, California
Using Sentinel-1 and GRACE satellite data to monitor the hydrological variations within the Tulare Basin, California
